Inhaltsverzeichnis
Management Report
 The PC CADDIE Management Report serves as a central planning and overview tool of a golf course. Every day, the report shows the turnover results of the profit centres as well as the utilisation evaluations of the courses and resources, membership trends and statistical developments. The results are displayed in comparison with the previous year and the planned budget.
The management report is displayed daily for authorised users; the report can also be sent automatically to operators and managers by email. The graphical presentation of the data aims to enable those responsible for a golf course to check the economic status of their facility at a glance. The system's individual statistics are also available for detailed analyses.
Costs: The Management Report is available to all PC CADDIE customers free of charge. For more detailed analyses, PC CADDIE provides a PRO version of the report, which allows more in-depth analyses and comparisons. The differences between the two versions can be found below.

Data protection: No personal data from the golf courses is sent or used for the preparation of the management report data. In addition, the required data is encrypted and anonymised in such a way that PC CADDIE and its employees cannot assign data or results to individual golf courses at any time.
Initial setup of the management report
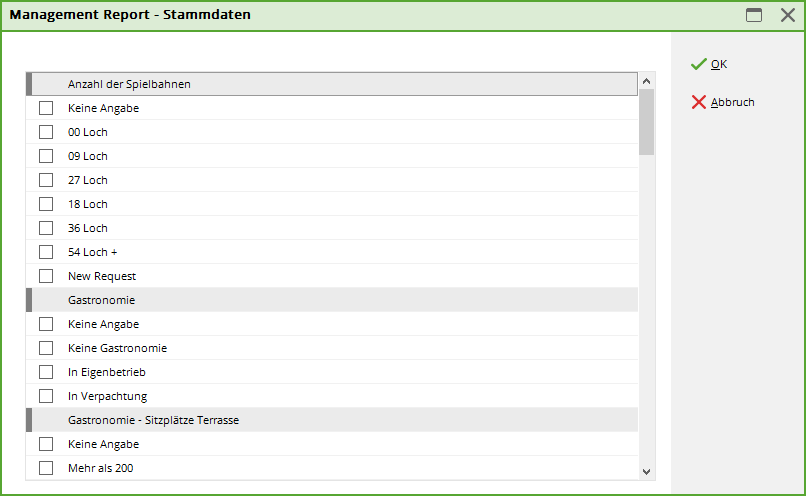
When the management report is set up for the first time, the following data is requested in order to enable statistical comparability: Legal form, year of opening, number of holes, location, hotel, practice facilities, restaurant, pro shop
Initial set-up
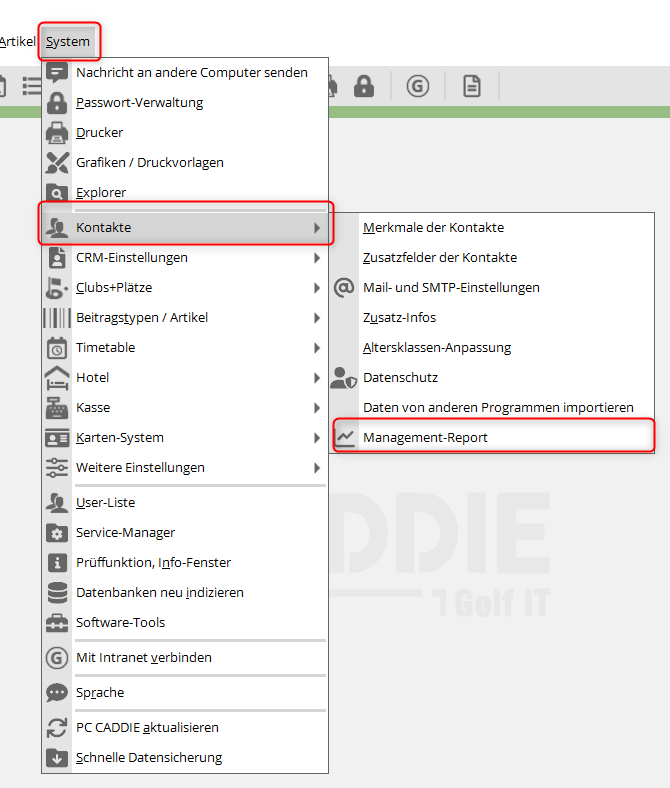
Under the menu item System Contacts you will find the menu item Management Report.
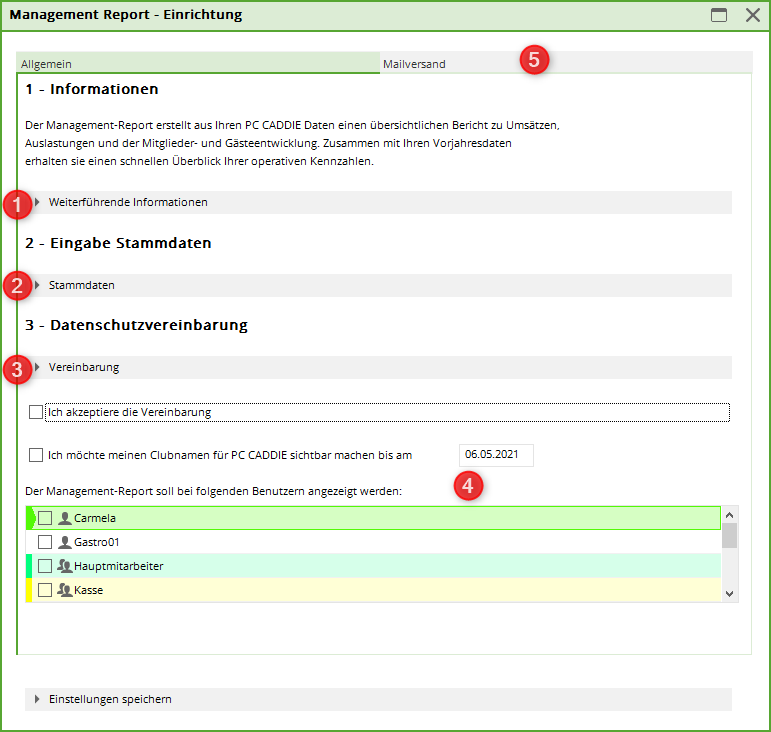
Installation/configuration is necessary first of all. Please work through all menu items (1 - 5):
1. our online manual opens here.
2. enter your master data for your golf course.
3. the privacy policy for the management report opens for reading.
4. enter the user rights for the report.
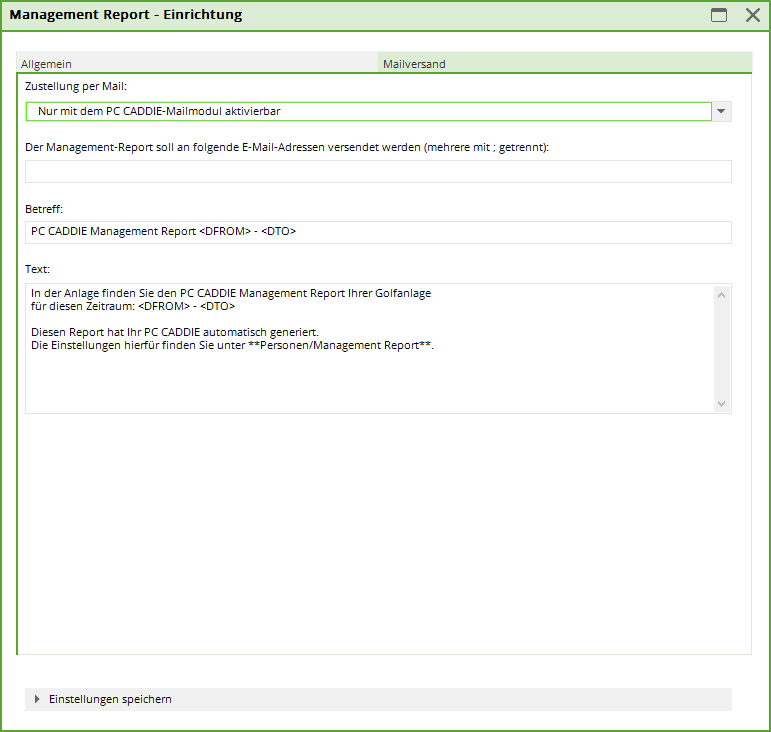
5. please enter the corresponding e-mail address for the regular dispatch of the Management Report. If you do not wish to receive the report regularly, leave this field blank. The „Online invoice dispatch“ module is a prerequisite for the regular dispatch of the management report mail. If you do not have this module, the Management Report Mail will not be generated.
The configuration is complete.
The configuration
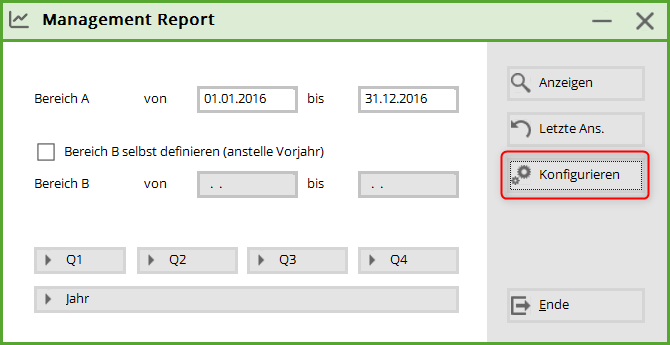
Once the initial setup has been completed, the following window opens:
In order to obtain an optimal evaluation, a corresponding configuration is necessary. You can find this under the button Configure.
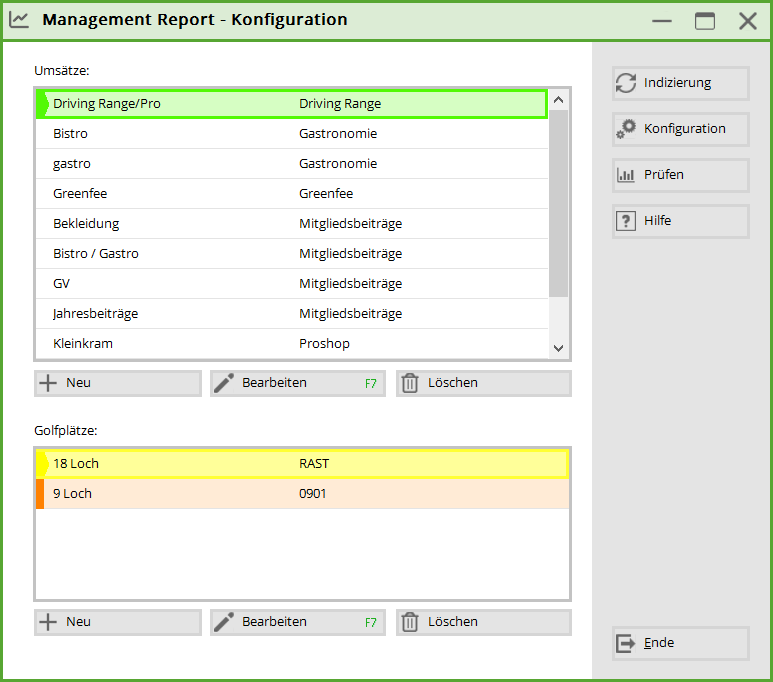
In the configuration, you define the sales and the golf courses. We start with the sales:
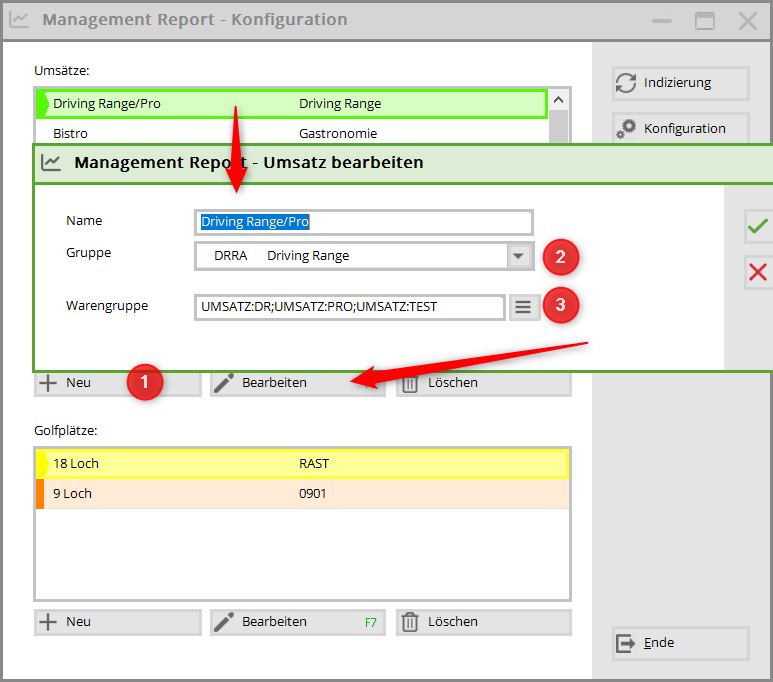
1. define your category.
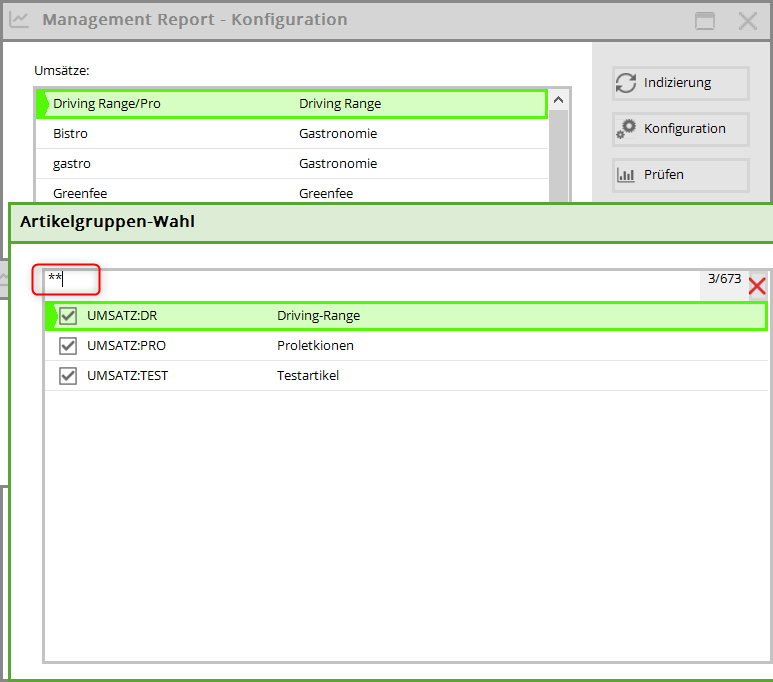
2. the following groups are available for selection: Membership fees, Green fee, Drving range, Proshop, Catering, Hotel, Other. To ensure that the management report is as complete as possible, all existing product groups should be integrated into one group. If a product group has been forgotten or not selected, this turnover is displayed in the Other column.
3. with the help of the list button  list button to select the desired merchandise categories. The account area is displayed first, followed by the merchandise category (here in the example SALES = account area, DR; PRO = merchandise category)
Here is an example of a sales configuration:
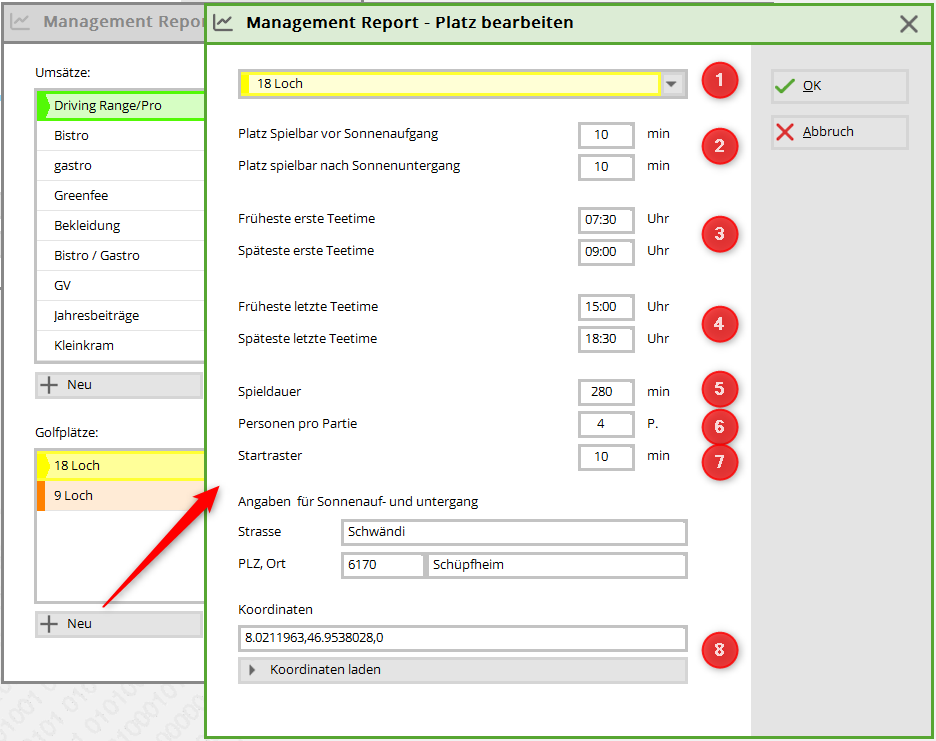
When configuring the golf courses, pay attention to:
1. select timetable area
2. enter the playability
3. „Earliest first tee time“: even if the sun rises earlier, the start times only start from the value entered (e.g. due to the opening times of the course) „Latest first tee time“: even if the sun rises later, the start time starts from the value entered (i.e. still in the dark for early players)
4. „Earliest last tee time“: even if the sun sets earlier, the start times start from the value entered (e.g. if the game is still permitted in the dark) „Latest last tee time“: even if the sun sets later, the last start time is possible up to the value entered (e.g. due to the opening times of the course)
5. general playing time for an 18-hole round of golf
6. enter the number of people per flight
7. starting grid
8. enter the address, then load the corresponding coordinates
With OK to end the configuration.
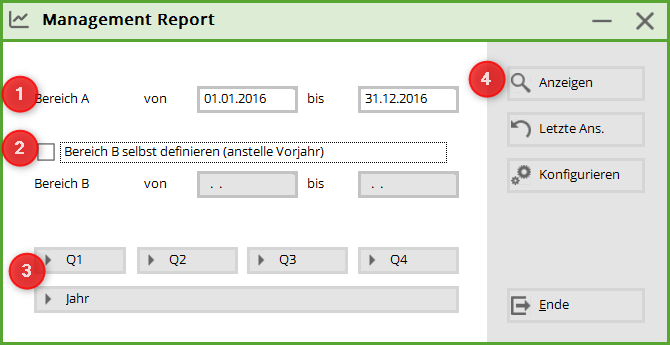
Creating the management report
1. area A: Please select your desired time range.
2. area B: If the comparison period should not correspond to the previous year, change the data here.
3. Q1 corresponds to the 1st quarter, Q2 the 2nd quarter, Q3 the 3rd quarter, Q4 the 4th quarter
4. by clicking on Show the analysis is generated for the selected period.
The management report analyses 4 areas
The management report analyses 4 general areas:
- 1. the turnover for annual fees, other fees, green fees, driving range, sports operations and other.
- 2. the rounds of golf divided into online and local bookings depending on members / green fees / tournaments
- 3. the course utilisation depending on playable days, available tee times and the general utilisation rate
- 4. your membersNumber of new members, departures, age structure and the breakdown of men and women
Please note the legend in each case:
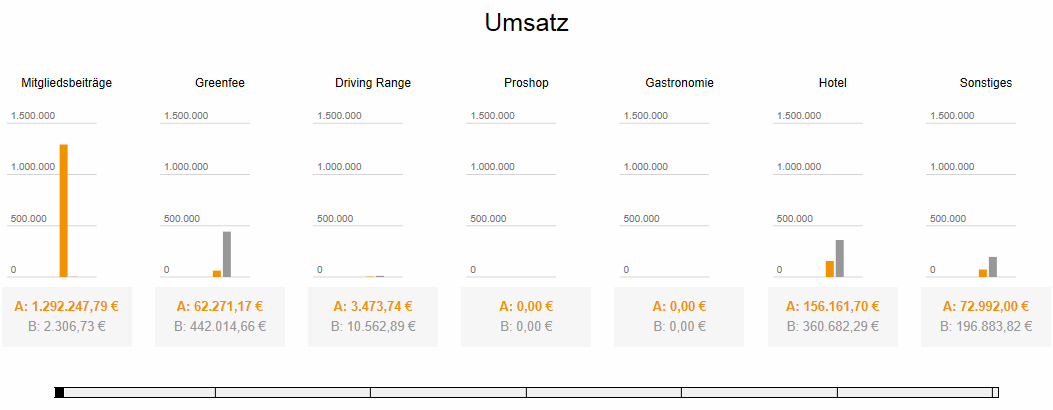
- orange bar = current values period A
- grey bar = Values period B (possibly previous year)
The management report only shows the current and previous year as a comparison. It is not possible to create the management report for 2-3 years in the past. The members are calculated for 4 years in the past.
1. turnover
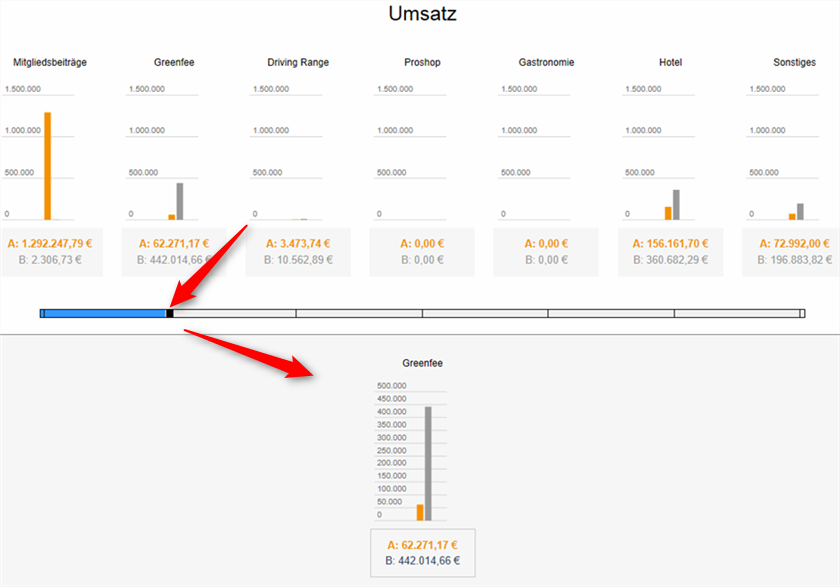
In this chart you can see the net turnover in the corresponding areas of membership fees, green fees, driving range, pro shop, catering, hotel and other for the selected period. You define the product groups in these analysis areas in the general configuration.
The lower bar can be moved to open the respective detailed information (for the Management Report Profi version):
The calculation of sales is possible for the current and last year. It is not possible to display previous years.
In order to obtain the comparative figures for the last year as well, it is necessary that the archive areas are ticked accordingly in the configuration. If the archive areas have not been archived accurately, i.e. the 2020 sales are in a 2020 archive area and the 2020 sales are also in the current 2021 area, then double sales figures are generated.
2. the golf rounds
A total of 96 rounds of golf were played in the relevant period, 10 of which were played by members and 86 by green fee guests. 16 bookings were made online and 80 bookings local were made. No tournament rounds were played. These are counted automatically when a tournament takes place.
This number of rounds of golf is distributed over your respective golf courses. The following detailed view shows the number of rounds per golf course created in the timetable. You can again recognise the rounds of members, guests and tournament rounds. The tournament rounds are counted from the respective tournaments in the competitions. If the tournaments have been imported into the timetable, they are ignored here.
In the configuration of the management report, the duration of a round per time table area is configured and not the number of holes. The utilisation is also calculated from this.
With the help of the button Show / hide details you can activate or deactivate this view.
3. space utilisation
The left-hand diagram in the space utilisation shows the times and days of the week. In our example, there were 9 people on the pitch between 9 and 10 a.m. on Saturday.
Here is an example:
Clicking on the day of the week changes the way the numbers are displayed (for better readability). The colour of the circles changes depending on the number of players: less than 7 players = orange circles, between 7 and 18 players = yellow circles, more than 18 players = green circles.
From a management report of more than 7 days, average values are given for court utilisation. Timetable suspensions are not counted in the court utilisation.
4. the members
The number of members is always calculated up to the print date (no future calculations). The management report shows the number of additions and departures up to the end date of the period (e.g. 31 December 2016).
This means: if you select a period from 1 January 2016 to 12 January 2016, for example, the entries are counted but no departures (no future calculations). Only with a period from 01/01/2016 to 31/12/2016 will you receive information on entries AND departures.
If you click on the respective coloured circles in the diagram on the right, you can see the numbers of members, men and women, juniors and seniors who have joined or left the club.
In the last three pie charts, you can see the distribution of playing rights, types of persons (individuals and organisations) and age distribution.
Indexing
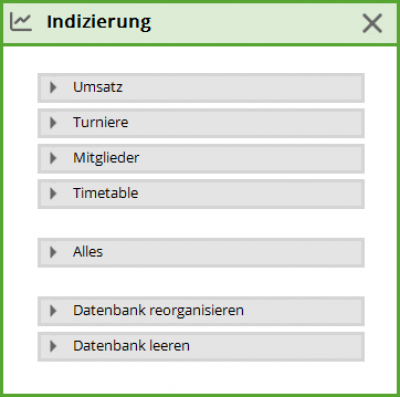
In the configuration you will find the button  If necessary, you can recalculate the corresponding areas of the management report here:
Versions & functionalities
The management report is offered in two versions: „Standard“ is available as a free version for all interested golf courses. „PRO“ is offered for professional users with customised set-up options. Please contact PC CADDIE support if you are interested.
| Functions | Standard module | PRO |
|---|---|---|
| all existing account areas can be configured and displayed under the categories membership fees/green fee/driving range/pro shop/catering/hotel/other | X | |
| Display „Turnover“ ACTUAL and PREVIOUS YEAR | X | |
| „Membership development“ display graphically summarised in groups | X | |
| Free choice of query period | X | |
| Display „Timetable utilisation“ as a coloured weekly graphic with utilisation display across all spaces | X | |
| Turnover„ display: Any number of freely definable, editable sub-areas in the sales display | X | |
| Freely selectable comparison period | X | |
| Display „Membership histories“: Definition and display of freely selectable sub-groups of membership types | X | |
| Display „Timetable utilisation“ as a coloured weekly graphic with utilisation display, individual slots/resources can be selected separately | X | |
| Automatic email dispatch (daily/weekly/monthly. Requirement for online invoice dispatch modules) | X | |
| Display „Turnover“ for the last 5 years | X |
Display active product groups
- Keine Schlagworte vergeben

