Inhaltsverzeichnis
"normal" complex statistics
General stocktaking
With the statistics function of PC CADDIE you can analyse your membership figures in a very complex way.
You can also easily analyse your membership figures for the individual member types or years using „Simple analysis of individual fields“. You can find a description of this here: Simple evaluation of individual fields.
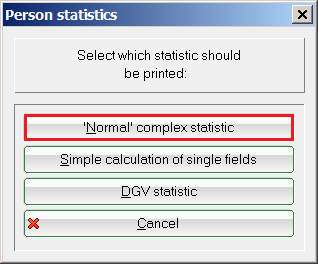
However, you can carry out a well-founded evaluation via Contacts/Statistics under the option 'normal' complex statistics option:
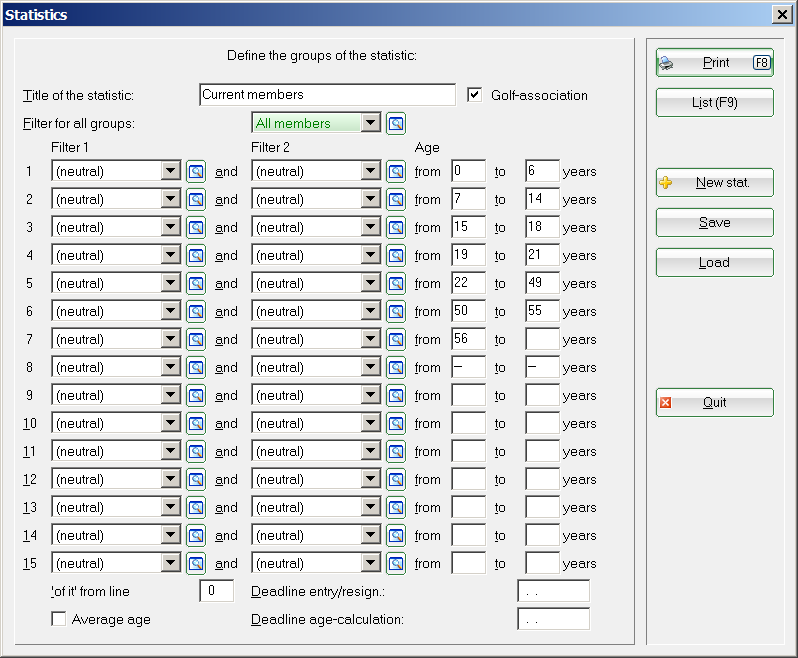
The statistics window will then open, in which you can easily enter the information you want to filter. To create statistics by age, simply enter the following under Age enter the different age categories:
You must define and name a filter for other separations.


If the statistics are still set from a previous printout, you can create a new statistic using the New stat. button to set everything to neutral and clear in one step.
Via the button Save button to save your statistics settings; and the next time you use the Load button next time. Please bear in mind that the person filters used may have been changed in the meantime. You should always check these before printing.
In order for the statistics to be printed correctly, all restrictions of a row must be fulfilled at the same time. In addition, the filter for all groups must also be fulfilled. If you only want one filter, leave the other one empty (in the drop-down list at the top!). However, two filters give you the practical option of selecting „All members“ for filter 1 and „Juniors“ for filter 2 - you will receive the number of junior members. If you do not wish to limit the age range, leave age leave both fields empty. If you put two dashes („–“) in the age fields, people without a date of birth will also be counted. Here are some examples of the age fields:
| from „0“ to „99“ | Only persons with dates of birth that result in an age between 0 and 99 |
|---|---|
| from „–“ to „–“ | Only persons without date of birth |
| from „ „ to „6“ | Persons up to 6 years of age (always inclusive) |
| from “–„ to „6“ | Persons up to 6 years of age, as well as persons without a date of birth |
| from „50“ to “ “ | Persons aged 50 and over (also inclusive) |
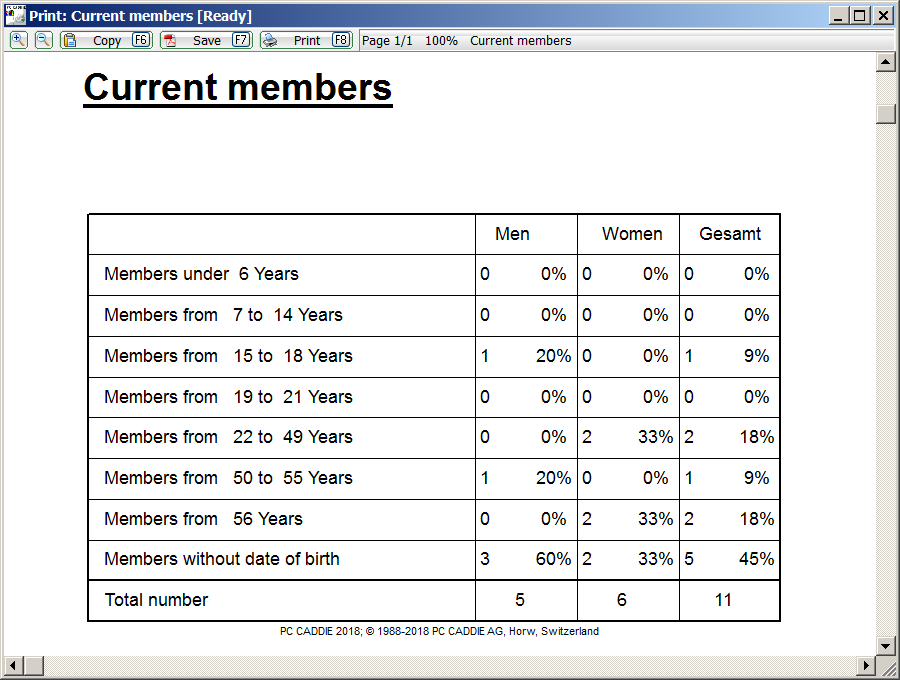
Via the button Print you will now receive the desired evaluation:
Checking the number of people
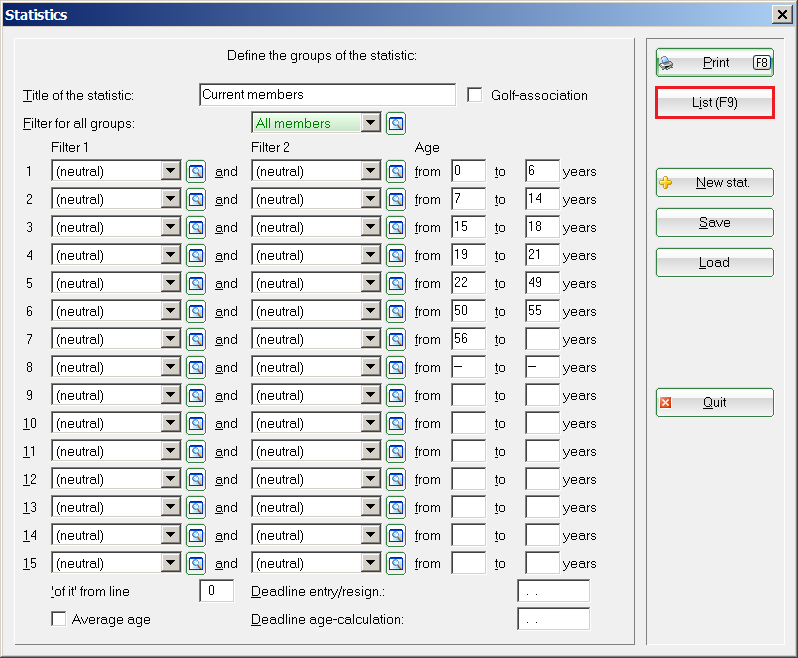
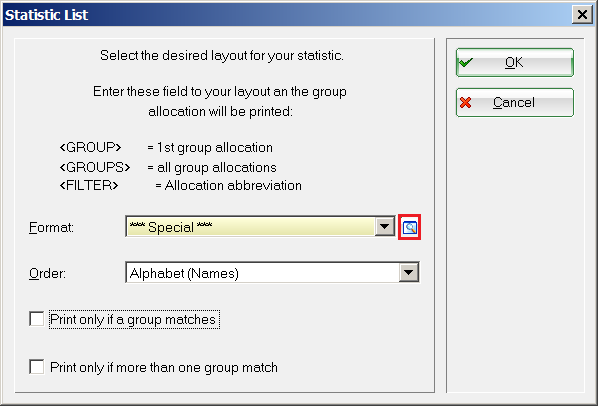
The list option is very helpful once all members have been counted. In the following window, click on the button List (F9):
The next window opens, in which you can select an existing list layout under Format. You can also create a new list layout using the magnifying glass symbol behind Format:
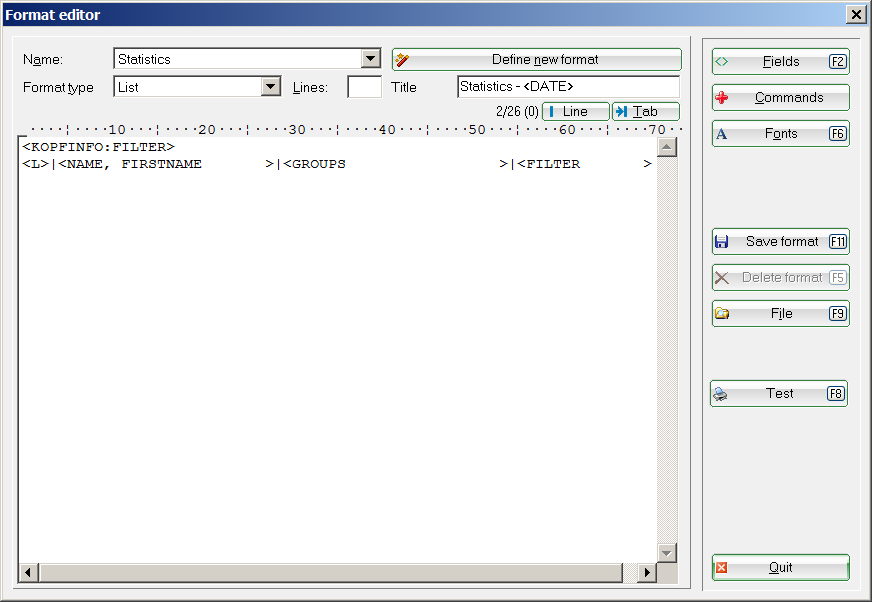
In the open editor window, create a new layout with the fields <GRUPPE> and/or <GRUPPEN> fields and save it:
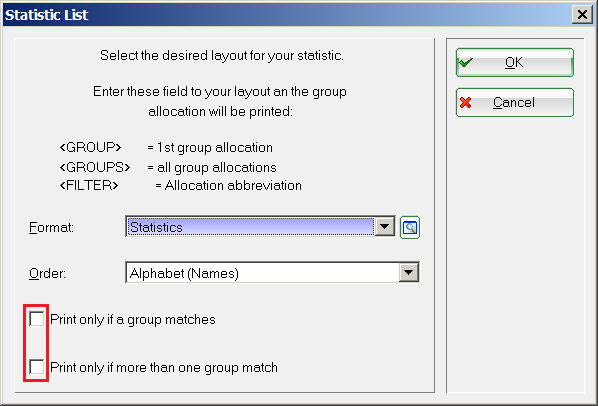
Then select in the window Statistics list window, select the desired options for the list printout and confirm your selection with OK:
You receive a list printout in which you can recognise which persons are hidden in your statistics. You can recognise which person is counted in which group and whether people may be counted twice if the filter settings are incorrect. filter settings, people may be counted twice.

- Keine Schlagworte vergeben

