
Dies ist eine alte Version des Dokuments!
Inhaltsverzeichnis
Statistics
PC CADDIE also allows you to print different statistics. Press the Print button from the symbols' list to access the statistics functionality. You can select here between classic and comprehensive statistics:

Freely definable occupancy list
Here you have the option of designing the allocation list in such a way that all the additional information you require is also printed.

- Click the most used information here
- You can format the selection of information to be printed here
- Select more information from the list.
Special layout
Create your own layout for the occupancy list. The support team will be happy to help.
As an example, a list with changes to the bookings in the selected timetable for a specific day:

- when the booking was recorded
- when the booking was changed
- when the booking was deleted
- number of changes on the defined day based on (1)
- number of changes on the defined day based on (2)
- number of changes on the defined day based on (3)
Normal statistics

For normal statistics you have to define the course and the persons group that are to be considered for the statistics, as well as the criterium.
 The evaluation is carried out, depending on the setting, as lists. Starting from this position:

… the first example sorts by Flight size (all persons), the second by Flight size (all members), and the third one by weekdays (all members):

- In total there are 2 individual games with 2 reservations; these are all real people.
- In total there is 1 three-game with 3 reservations; 2 of these are real people (third entry is information).
- In total there are 2 four-games with 8 reservations; these are all real people.
- In total there are 5 reserved games with 13 reservations; 12 of these are real people.

- In total there are 2 individual games with 2 reservations; one game is reserved by members, which means 1 reservation through a member.
- In total there is 1 three-game with 3 reservations; one game is reserved to one member.
- In total there are 2 four-games with 8 reservations; one game is reserved by 2 members.
- In total there are 5 reserved games with 13 reservations; 3 games are reserved by 4 members.

HINT: This view can also be sorted by date, month or year.
Extensive statistics
Information regarding bookings and flight assignments can be filtered out in the extensive timetable statistics:
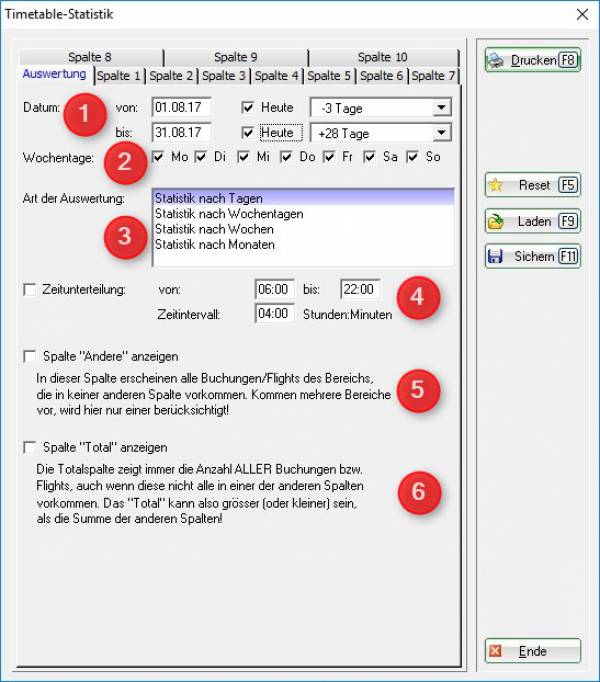
Evaluation is used to define the period over which the numbers are to be bundled:
- Define the period over which you want to have the evaluation. Enter the date by hand (click with the right mouse button in the date window to see a calendar) or check the box at today and select in the next field the number of days (forward or backward) that should be considered starting withthe selected date.
- If only certain days of the week are to be evaluated, define them here.
- Define here whether the evaluation should be cumulated daily or corresponding to the criterium
- Here you have the possibility to summarize a period of time, e.g. Morning / afternoon or morning / noon / evening, etc.
- Numbers that are not filtered are shown here
- Shows the total of all bookings in the timetable
Columns 1-10 Define different filters in each column. You will get various evaluations on a single list.
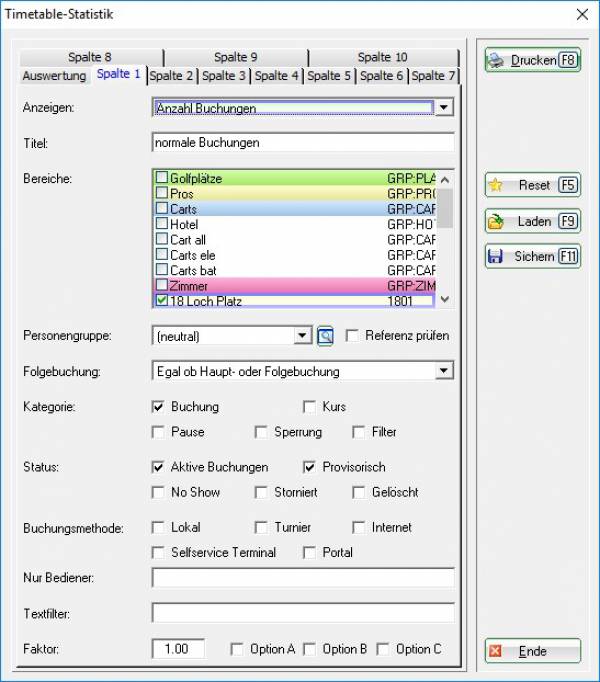
With the diverse selection of Views you can print simple evaluations of bookings or people, but also determine the occupancy in terms of flights with and without duration. The evaluations can be made in relation to a specific group of people or globally.
HINT: If you frequently work with tour operators/travel agencies/hotels, you can filter these bookings separately. Define the personal filter so that it draws to the tour operator, the travel agency or the hotel by entering the additional information TOUROP. Now check the box Check reference. The filtering is now done based on the tour operator and not on the golfer.
In the following expression, we assume the same situation as in the case of Simple statistics.

The bold numbers indicate the daily total. The overall total (4) is printed at the end of the list.
- There are 4 games in total reserved by 4 members. A person is the only member in a game twice, while two members are participating in the same game only once.
- There are 4 games in total reserved by 8 guests. A person is the only guest in a game twice, two guests are participating in the same game once, and the last game of four is reserved entirely by guests.
- In total there are 2 single-games, 1 two-game, 0 tree-games and 2 four-games.
The daily total differs from the overall total in case you make the statistics for several days. Only one day was evaluated in our example.
Print members Greenfee bag tags
This function gives you the possibility to print all the bag tags for your members (or for already defined groups) in only one step:

Define the desired group and set the time interval and the article that needs to be booked when printing the bag tag.
The article must be free-of-charge. Also consider the possibility that an existing automatic process may hinder the automatic printing.
List of expected sales
You can also use the extensive timetable statistics for the revenue forecasts. Thus, not only the already booked rounds, but also the resulting revenues are printed. The prerequisite for this is that every booking is associated with an article:

This input can be controlled or entered manually via the Automatic article.
To list the price calculation in the statistics, define a column as follows:

The provisional bookings are also activated for the calculation in our screenshot. This makes sense if you work together with hotels or tour operators, and also want to have the not yet definitely confirmed bookings included in your calculation.
This is how your statistics look like:

- Keine Schlagworte vergeben
PC CADDIE AG
Bachtelweg 3
6048 Horw/Luzern
Schweiz
Kontakt
![]() Fon +49 2642 9854110
Fon +49 2642 9854110
Fax +49 2642 9854199
![]() Fon +41 41 5110600
Fon +41 41 5110600
Fax +41 41 5110699
![]() Fon +43 13 55667788
Fon +43 13 55667788
Fax +43 13 55667799
Mail support@pccaddie.com
Web www.pccaddie.com
Support Online-Module
PC CADDIE://online
GmbH & Co. KG
Fon: +49 2642 9854120
Fax: +49 2642 9854169
Mail support@pccaddie-online.de
Web www.pccaddie-online.de
Tägliche Supportzeiten:
April-Oktober
09.00 - 20.00 Uhr
November-März
09.00 - 18.00 Uhr